Fullcrm’s 3 easy step guide to improve your Salesforce Data
Clean and consistent data is an asset to any business and provides essential insights into past, current and expected performance.
Many businesses underestimate the importance and value of their data and allow their users to enter limited information in their system. It does not matter how well the platform is configured if it is running on weak data; the business will always be playing catch up.
Now is the perfect time to focus on the quality of your Salesforce data.
Here is our 3 step guide on how to enrich your Salesforce data
1. Review your data to determine what needs to be updated:
Firstly you want to understand the current state of your data to determine what needs to be updated.
Start by reviewing your objects and detail what fields are critical to your business:
E.g. All Leads need to have a:
- Title
- Phone Number
- Website
To understand how populated each field, we recommend creating a list view and utilising list view charts:
How to create a list view:
- Select the object from the menu bar (leads, contacts, accounts, opportunity)
- From the list view controls (cog wheel) > select new
- Name the list view
- Select whom you want to share the list view with:
- Only you
- All users
- Group of users
- Click save
- Add filters, i.e. All Accounts
- Click Save
- Determine the fields you want to display from the list view controls (cogwheel) and select fields to display
- Move the fields you want visible within the list view > make sure to include the field that you want users to update
How to create a list view chart to identify the gaps in your data
- Select the list view created above
- Click the pie chart icon on the right-hand side of the screen
- In the charts panel that appears, click the cogwheel
- Select New Chart
- Enter a chart name
- Select a chart type: vertical bar, horizontal bar, or doughnut.
- Select the following:
- The aggregate type specifies how the field data is calculated: Select Sum
- The aggregate field specified the type of data to calculate: select a key field: i.e. website
- The grouping field labels the chart segments: i.e. Lead Owner
- To view your chart, click save
2. How to empower your users to update their existing records:
It is unlikely that you will have great success asking your Salespeople to update the data by editing each record on mass.
Create a list view following the above steps and share with your users.
They will be able to begin mass editing from the list view.
Tips for inline editing list view:
- You cannot make inline edits across multiple record types in a list view. *If you are using them, filter your list view to a specific record type.
- Fields that can be updated will have a pencil when you hover your mouse over them
- Fields that cannot be updated will have a lock when you hover your mouse over them * Review here the field types that are available for inline editing
- Don’t forget to save!
If there are still gaps in your data and your users are struggling to update their records you should engage a data specialist. We recommend reaching out to Database Consultants Australia (DCA) to discuss your data quality and enrichment needs.
3. Maintain your data quality
Now that you have put in place the steps to update your data, you need to consider how you will continue to maintain this in the future.
We recommend setting your employees KPI’s around creating and maintaining rich and accurate data. Setting KPI’s around this will emphasise the value of the data they are putting into Salesforce.
Here is an example of the formula for data quality score on an Account:
IF(ISBLANK( Phone ),0,0.25) + IF(ISBLANK( Website ),0,0.25) + IF(ISBLANK( BillingAddress ),0,0.25)+ IF(ISBLANK( ABN__c ),0,0.25)
Using the formula field to determine the data quality score will provide the users with a visual queue as to how complete the data is on a record. It will also help you track which users are entering valuable data.

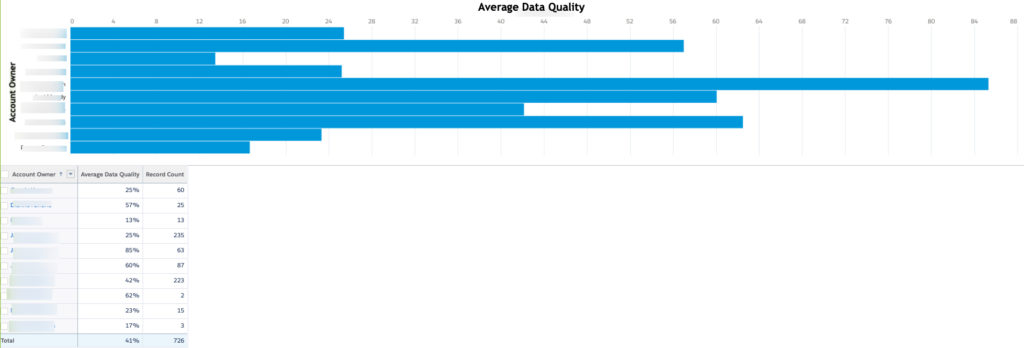
To report on this, we recommend setting up a report using the standard Salesforce reports based on the object of focus, i.e. Accounts.
How to set up the report:
- Add in columns the data quality score field
- Edit the field and summarise by average
- Group by Account Owner
- Select the chart icon
- Save and run